Poster by Esther van Leeuwen for BRAIN 2022
Methods
Animals
Adult, 10-14 weeks, C57BL6 Charles River female (19-25 g) or male (23-30 g) mice were kept on a standard chow diet with free access to water. Mice were group-housed in open cages under 12:12 hours light:dark cycles. All animal procedures and experiments were approved by the Animal Experiments Committee of the University Medical Centre Utrecht and Utrecht University and were performed in accordance with the guidelines of the European Communities Council Directive.
Experimental Design
Animals were randomly divided into three groups (N=14 per group) and received saline, vehicle (1mmol β-cyclodextrin) or 10 mg/kg LEI-102 treatment. Mice underwent transient middle cerebral artery occlusion with an intraluminal filament for one hour. With the filament still inserted, mice were subjected to diffusion-weighted MRI to detect the ischemic area. Subsequently, mice received three serial intraperitoneal injections of either saline, vehicle or LEI-102 (volume = body weight x 5 ul), at 20 min, 24 h and 48 h after reperfusion. At day three, mice were subjected to T2-weighted MRI to determine the final lesion size. Thereafter, mice were euthanized under isoflurane anesthesia and a subsequent cardiac puncture followed by intracardial perfusion with 10 mL PBS. The femur, spleen and brain were harvested for further flow cytometry analysis.

Middle cerebral artery occlusion
Mice were subjected to one hour of right middle cerebral artery occlusion (MCAo)1 followed by reperfusion for 72 hours. Anesthesia was induced with 4.0% isoflurane and maintained at 1.5-2.0% during surgery. Body temperature was monitored using a rectal probe and maintained at 37 ± 0.5 °C. A local anesthetic, lidocaine, was applied to the area of the surgical incision.
A midline incision was performed near the neck and connective tissue was pulled back to expose the common carotid artery (CCA), external carotid artery (ECA) and the internal carotid artery (ICA). A 6-0 suture was inserted around the CCA for a temporary closure of CCA flow. Another 7-0 suture was tied in a permanent knot around the ECA distal from the bifurcation. The branching arteries from the ECA were coagulated before preparing the final loose collar suture (6-0 silk) around the proximal ECA just above the CCA bifurcation. A vascular clamp was placed on the CCA after which an arteriotomy of the reflected ECA was performed. A 220 μm silicon-tipped monofilament was introduced via the arteriotomy in the ECA until the applied vascular clamp in the bifurcation was reached. The loose collar suture round the proximal ECA was tightened before the vascular clamp was removed. The ECA was cut close to the permanent suture and it was flipped parallel with the CCA. The filament was guided to the base of the MCA through the ICA until a mild resistance was felt (9-11 mm from the bifurcation).
After an hour of MCAo the suture around the filament was loosened, the filament was carefully withdrawn and the suture around the ECA was permanently tied. Buprenorphine (0.05 mg/kg) was injected in the wound immediately after surgery for pain relief. The wound was cleaned using an alcohol pad and the skin was closed with stitches. A 1 mL saline injection was given subcutaneously for fluid replacement. The mice were placed in a heated recovery cage for one hour
MRI
MRI scans were acquired on a 9.4T Varian small animal MR system with a Varian gradient (inner diameter = 60 mm, maximum gradient strength 1000 mT/m) and a Bruker Biospin MRI GmhB quadrature coil (inner diameter = 35mm). Mice were anesthetized as described above and anesthesia was maintained with 1.5-2.0 % Isoflurane in 0.3 L/min O2 under spontaneous breathing. Body temperature was monitored using a rectal probe and maintained at 37 ± 0.5 °C
During MCAO, diffusion-weighted imaging (DWI: repetition time (TR) = 5000 ms, effective echo time (TE) = 23.5 ms, n = 6, b=0 , 1200 s/mm2 , slice thickness = 0.5mm , data matrix = 100 x 100, field of view = 20 x 10 x 20) was executed, from which apparent diffusion coefficient (ADC) maps were calculated for delineation of the acute ischemic lesion.
After 72 hours, a fast spin echo multi-slice acquisition (FSEMS: TR =4000 ms, echo spacing = 9.0 ms, Effective TE=27 ms, n = 4, 0.5mm slice thickness) coronal slices, with a field-of-view of 20 x 10 x 20 mm3 and a matrix of 256 x 20 x 256 were obtained to determine infarct volume.
Lesion progression was determined by a blinded researcher from the percent change in volume between the acute ischemic lesion and the final infarct. Data were analyzed by one-way ANOVA, with a post hoc Dunnett test.
Neurological test
A basic neurological test was used to assess the neurological status of the animals. Animals were tested 24 and 48 hours after stroke on a 21 point scale (Table 1), combined from Bertrand et al, the Garcia scale, and Bederson scale. 2-4 A two-way ANOVA was performed to determine treatment and time effects.
Table 1 Neurological scoring scale (min = 2 max = 21)
| General condition | Self-cleaning behavior/grooming4 (hair condition) | 0: None 1: Normal |
| Ear position4 | 0: Droopy 1: Raised | |
| Spontaneous activity in a clean cage4 | 0: Unconscious / no movement 1: Low activity (barely moves, does not rise to any side of the cage) 2: Normal activity (moves around, extends against walls) | |
| Sensorimotor function | Circling Behavior3 (open bench) | 0: pivoting, swaying, or no movement 1: circles constantly to one side 2: circles to one side, not constantly 3: predominantly one-sided turns 4: not present |
| Symmetry in movement of four limbs2 (when suspended by tail) | 0: forelimb on left side does not move at all 1: limbs on left side exhibit minimal movement 2: limbs on left side extent less than right side 3: All four limbs extend symmetrically | |
| Body proprioception2 (stimulus on the side) | 1: does not react to stimulus on left side 2: reacts slowly to stimulus on left side 3: reacts by turning head, equally startled by stimulus on both sides | |
| Vibrissae touch2 | 1: does not react to stimulus on left side 2: reacts slowly to stimulus on left side 3: reacts by turning head, equally startled by stimulus on both sides | |
| Lateral push3 | 0: Consistent reduction in resistance to lateral push towards left side 1: No reduction in resistance to lateral push towards left | |
| Forepaw Outstretching2 (held by tail on edge of table) | 0: Left forelimb does not move 1: Left forelimb moves minimally 2: Left side outstretched less than the right, forepaw walking impaired 3: Both forelimbs outstretched, mouse walks symmetrically on forepaws |
Tissue Processing
Mice were anesthetized with isoflurane and fixed by pinning all four legs in a supine position. The abdomen and thorax were opened. At least 400 µL blood was taken with an insulin syringe from the heart’s right ventricle. After perfusion with saline the spleen, femur and brain were collected and put in an Eppendorf tube with 1 mL FACS buffer. FACS buffer consisted of 1% bovine serum albumin (BSA), 0.1% sodium azide and phosphate-buffered saline (PBS).
Blood
The blood was treated with EDTA and resuspended with 1 mL lysis buffer (ThermoFisher) Followed by incubation for 4 minutes at room temperature. After adding 5 mL FACS buffer and centrifugation for 8 min at 340g at 4 °C, the supernatant was removed. Lysis was repeated twice, after which the cell pellet was resuspended in 100µL FACS buffer and stored on ice. These steps were executed twice to receive 2 samples.
Spleen
A small piece from the spleen (ca. 20mg) was taken and transferred to a 70µm strainer with 15mL FACS buffer. After centrifugation for 8 min at 340g at 4 °C the supernatant was removed. 1 mL lysis buffer was added followed by incubation for 4 minutes at room temperature. Cells were washed with 5 mL FACS buffer and centrifuged for 8 min at 340g at 4 °C. The supernatant was removed and cells were resuspended in 500µL FACS buffer. Two Eppendorf tubes were filled with 100 µL of this suspension and stored on ice.
Bone marrow
The two ends of the femur were trimmed. The bone marrow was flushed from the two parts of the femur with 10mL FACS buffer and a needle through the 70µm strainer into a 50mL Falcon tube. After centrifugation for 8 min at 340g at 4 °C, the supernatant was removed and 1mL lysis buffer was added. After 1 minute incubation at room temperature, 5 mL FACS buffer was added and centrifuged for 8 min at 340g at 4 °C. The supernatant was removed and resuspended in 1mL FACS buffer. Two Eppendorf tubes were filled with 100 µL of this suspension and stored on ice. 200µL of this sample was also used for the unstained control and another 100µL for the viability dye control.
Brain
After the brain was taken out, the cerebellum was removed. The brain was cut in half and each hemisphere was placed in a different Eppendorf tube with FACS buffer on ice. The hemispheres were placed in tubes with 4mL digestion buffer (5mL HBBS (Fischer Scientific), 10% FBS (Sigma-Aldrich) and 1% collagenase (Sigma-Aldrich)). The samples were passed through a 70µm cell strainer to a 50mL falcon tube, after digestion of 20 min at 37 °C. The suspension was strained with 30mL FACS buffer and centrifuged for 5 minutes at 450g at 4 °C. Supernatant was removed and resuspended in 10.5mL FACS buffer and homogenized with 4.5 mL of isotonic Percoll (Sigma-Aldrich) during 35min centrifugation at 900g at 4 °C without a break. The Percoll was washed off with 10mL of FACS buffer, centrifuged for 5 min at 450g at 4 °C and resuspended in 200µL FACS buffer.
Cell Staining
The cell suspensions were incubated with 10µL anti-murine FC-receptor blocking solution (5%) reagent for 10 min. The fluorophore- conjugated lymphoid or myeloid antibody cocktail was added to the cell suspension and incubated for 30 min in the dark at 4 °C (Table 2 and 3). Cells were washed with 1mL FACS buffer and centrifuged at 450g for 5 min at 4 °C. The cell pellet was resuspended in 2% paraformaldehyde (PFA) for 15 minutes for fixation. It was washed twice with 1mL FACS buffer and centrifuged for 5 min at 750g at 4 °C. The supernatant was removed and resuspended in 200µL of cold FACS buffer and stored at 4 °C in the dark until FACS analysis.
Compensation beads were used for multi-color compensation. 0.5µL of antibody was added into 50µL of compensation beads. These antibodies were incubated for 30 min in the dark at 4°C. It was washed twice with 1 mL FACS buffer and centrifuged for 5 min at 400g at 4°C. The supernatant was removed and resuspended in 300µL FACS buffer.
100µL of bone marrow sample was put in a warm water bad at 95 °C for 15 min and stained with 100µL viability dye solution. This sample was used for control of the viability dye. Also 200µL of bone marrow sample was put in an Eppendorf which was used as unstained control.
Table 2 Antibody cocktail bonemarrow, blood and spleen samples
| Antibody | Colour | Binds at: | Vendor (cat. No.) | dilution | Panel |
| CD11b | Alexa Fluor488 | Monocytes/ macrophages, granulocytes, a subset of NK cells | Thermofisher (53-0112-82) | 1:300 | myeloid |
| CD115 | APC- eFluor780 | Monocytes and macrophages | Thermofisher (47-1152-82) | 1:300 | myeloid |
| Ly6G | PE | Neutrophils | Thermofisher (47-9668-82) | 1:300 | Myeloid |
| Ly6C | PerCP-Cyanine5.5 | Monocytes and macrophages | Thermofisher (45-5932-82) | 1:300 | Myeloid |
| CD3e* | PE-Cyanine7 | T cells | Thermofisher (25-0031-82) | 1:300 | Myeloid and lymphoid |
| CD19* | PE-Cyanine7 | B cells | Thermofisher (25-0193-82) | 1:300 | Myeloid and lymphoid |
| CD45 | FITC | All hematopoietic cells excluding mature erythrocytes and platelets | Thermofisher (11-0451-82) | 1:300 | lymphoid |
| CD11c | APC-eFluor780 | macrophages | Thermofisher (47-0114-82) | 1:300 | Lymphoid |
| F4/80 | PerCP-Cyanine5.5 | macrophages, peritoneal eosinophils and some dendritic cell subtypes | Thermofisher (45-4801-82) | 1:300 | Lymphoid |
| CD3e | PE | T cells | Thermofisher (12-0031-82) | 1:300 | Lymphoid |
| Viability dye | eFluor660 | Dead cells | Thermofisher (65-0864-18) | 1µL/mL | Myeloid and lymphoid |
| TER119* | PE-Cyanine7 | Erythroid cells | Thermofisher (25-5921-82) | 1:300 | Myeloid |
| CD117* | PE-Cyanine7 | Hematopoietic progenitor cells | Thermofisher (25-1171-82) | 1:300 | Myeloid |
*Were used for lineage
Table 3 Antibody cocktail brain samples
| Antibody | Color | Function | Vendor (cat. No.) | dilution | Panel |
| CD11b | Alexa Fluor488 | Monocytes/ macrophages, granulocytes, a subset of NK cells, microglia | Thermofisher (53-0112-82) | 1:300 | Myeloid |
| CD45 | APC- eFluor780 | All hematopoietic cells excluding mature erythrocytes and platelets | Thermofisher (47-0451-82) | 1:300 | Myeloid |
| LY6G | PE | Neutrophils | Thermofisher (47-9668-82) | 1:300 | Myeloid |
| LY6C | PerCP-Cyanine5.5 | Monocytes/ macrophages, endothelial cells and granulocytes | Thermofisher (45-5932-82) | 1:300 | Myeloid |
| CD3e | PE | T cells | Thermofisher (12-0031-82) | 1:300 | Lymphoid |
| CD45 | FITC | All hematopoietic cells excluding mature erythrocytes and platelets | Thermofisher (11-0451-82) | 1:300 | lymphoid |
| CD19* | PE-Cyanine7 | B cells | Thermofisher (25-0193-82) | 1:300 | Lymphoid and myeloid |
| Viability dye | eFluor660 | Dead cells | Thermofisher (65-0864-18) | 1µL/mL | Myeloid and lymphoid |
| CD8 | PerCP-Cyanine5.5 | Thymocytes, subpopulation of mature alpha beta T cells, and dendritic cells | Thermofisher (45-0081-82) | 1:300 | Lymphoid |
| CD4 | APC- eFluor780 | Thymocytes, subpopulation of mature T cells and dendritic cells | Thermofisher (47-0041-82) | 1:300 | Lymphoid |
| CD3e* | PE-cyanine 7 | T cells | Thermofisher (25-0031-82) | 1:300 | Myeloid |
| TER119* | PE-Cyanine7 | Erythroid cells | Thermofisher (25-5921-82) | 1:300 | Myeloid |
| CD117* | PE-Cyanine7 | Hematopoietic progenitor cells | Thermofisher (25-1171-82) | 1:300 | Myeloid |
*Were used for lineage
Fluorescence- activated cell sorting (FACS)
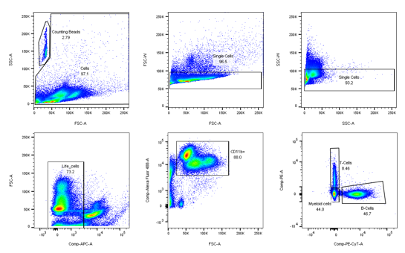
For this measurement a cytometer with a blue (488nm) and red (635nm) laser and filter for Alexa 488, PE, PerCP, PE-Cy7,APC and APC-Cy7 was used. 250µL of each sample solution was pipetted into a 96-well plate. Antibody captured compensation beads were used to perform multi- color compensation by displaying every single color in a histogram to set gates. Doublets were first discriminated from single- cells in a dot plot showing the area and weight of forward scatter (FSC) and side scatter (SSC). For the FACS of brain samples a different gating strategy (figs. 1-3) was used compared to the spleen, blood and bone marrow samples. Cell subpopulations were defined according to this gating strategy below. The immune composition of tissues was assessed by a blinded researcher using FlowJo analysis software.
Figure 1 Brain myeloid panel gating
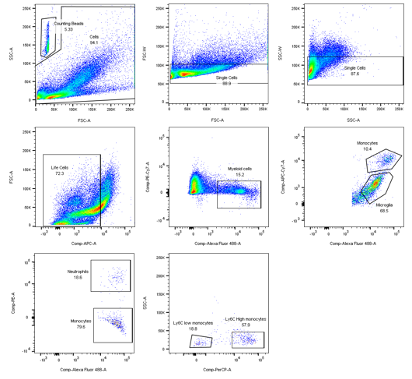
Figure 2 Blood, Bonemarrow, Spleen lymphoid gating

- H. K. Smith, J. M. Russell, and et al. Critical differences between two classical surgical approaches for middle cerebral artery occlusion-induced stroke in mice. Journal of Neuroscience Methods, 249:99-105, April 2015.
- Garcia JH, Wagner S, Liu KF, Hu XJ. Neurological deficit and extent of neuronal necrosis attributable to middle cerebral artery occlusion in rats. Statistical validation. Stroke. 1995 Apr;26(4):627-34
- Bederson JB, Pitts LH, Tsuji M, Nishimura MC, Davis RL, Bartowski H: Rat middle cerebral artery occlusion Evaluation of the model and development of a neurological examination. Stroke 1986, 17: 472–476.
- Bertrand, L., Dygert, L., Toborek, M. Induction of Ischemic Stroke and Ischemia-reperfusion in Mice Using the Middle Artery Occlusion Technique and Visualization of Infarct Area. J. Vis. Exp. (120), (2017).